Command Palette
Search for a command to run...
Iterative transcription factor screening enables rapid generation of microglia-like cells from human iPSC
Iterative transcription factor screening enables rapid generation of microglia-like cells from human iPSC
Abstract
Differentiation of induced pluripotent stem cells (iPSCs) into specialized cell types is essential for uncovering cell-type specific molecular mechanisms and interrogating cellular function. Transcription factor screens have enabled efficient production of a few cell types; however, engineering cell types that require complex transcription factor combinations remains challenging. Here, we report an iterative, high-throughput single-cell transcription factor screening method that enables the identification of transcription factor combinations for specialized cell differentiation, which we validated by differentiating human microglia-like cells. We found that the expression of six transcription factors, SPI1, CEBPA, FLI1, MEF2C, CEBPB, and IRF8, is sufficient to differentiate human iPSC into cells with transcriptional and functional similarity to primary human microglia within 4 days. Through this screening method, we also describe a novel computational method allowing the exploration of single-cell RNA sequencing data derived from transcription factor perturbation assays to construct causal gene regulatory networks for future cell fate engineering.
One-sentence Summary
An iterative, high-throughput single-cell transcription factor screening method identified a six-factor combination (SPI1, CEBPA, FLI1, MEF2C, CEBPB, IRF8) sufficient to differentiate human iPSCs into microglia-like cells within 4 days, and the accompanying computational approach constructs causal gene regulatory networks from TF perturbation scRNA-seq data to guide future cell fate engineering.
Key Contributions
- An iterative, high-throughput single-cell transcription factor screening method identifies combinations needed for human iPSC differentiation, using limited transcription factors per round and carrying forward top hits to disentangle complex gene regulatory networks.
- The method is validated by showing that SPI1, CEBPA, FLI1, MEF2C, CEBPB, and IRF8 convert human iPSCs into microglia-like cells with transcriptional and functional similarity to primary human microglia within four days.
- A computational method analyzes single-cell RNA sequencing data from transcription factor perturbation assays to construct causal gene regulatory networks, with RNA-seq comparisons indicating that the induced cells progress toward transcriptional states resembling longer-differentiated microglia.
Introduction
Differentiating human stem cells into hard-to-access specialized cell types, such as brain immune cells, is important for studying disease mechanisms and developing therapeutics, especially when patient biopsies are unavailable and animal models do not translate well. Prior transcription factor induction methods can generate some cell types but often struggle with complex regulatory programs, rely on single-step induction, lack precise timing and dosage control, and require lengthy growth-factor protocols for microglia. The authors address this by combining iterative pooled transcription factor library screens in human induced pluripotent stem cells with high-throughput single-cell RNA sequencing to systematically identify cell-fate regulators. They validate the workflow by discovering a transcription factor combination, including SPI1, CEBPA, FLI1, MEF2C, CEBPB, and IRF8, that generates microglia-like cells within 2 days, compared with standard protocols taking about 35 days, while also revealing regulatory relationships between transcription factors and gene expression.
Dataset
-
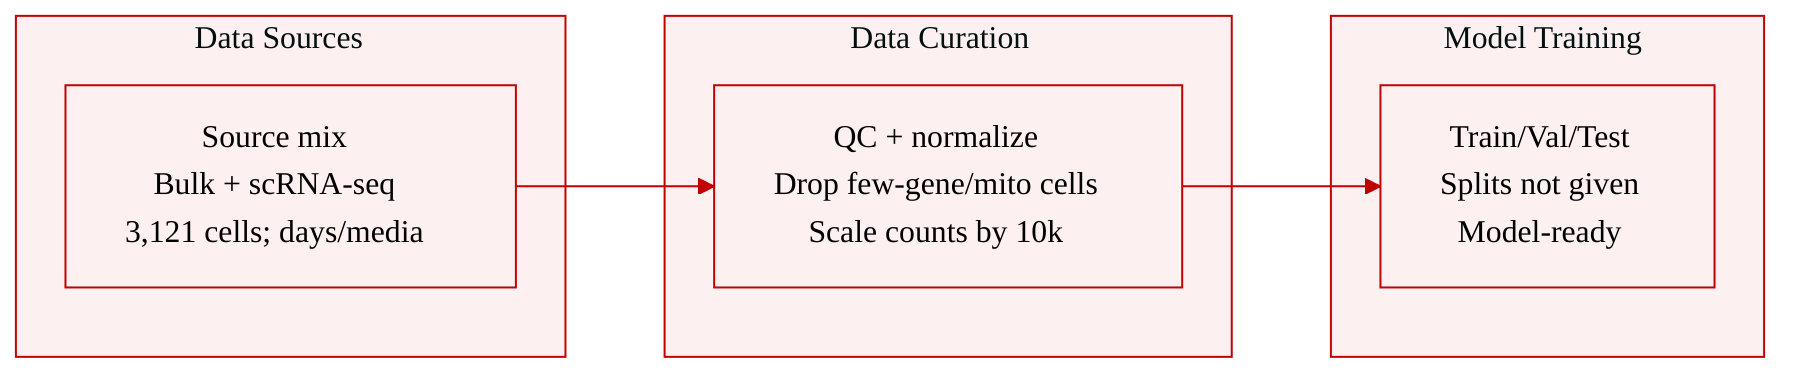
The dataset consists of gene expression data generated by the authors, including bulk RNA-seq and single-cell RNA-seq from iPSC-derived TFiMGLs. The single-cell data cover undifferentiated iPSCs and TFiMGLs collected at day 2, day 4, and day 6, with day 4 and day 6 samples collected under two culture conditions: mTeSR Plus media and microglia media.
-
The analyzed single-cell dataset contains 3,121 cells, distributed as reported across five time and condition groups: 1,178 day 2 TFiMGLs, 308 day 4 microglia media cells, 727 day 4 mTeSR Plus cells, 438 cells in one day 6 mTeSR Plus group, and 470 cells in another day 6 mTeSR Plus group.
-
The samples were processed using Parse Biosciences fixation and whole transcriptome library preparation, sequenced on an Illumina NextSeq 500, and converted into demultiplexed FASTQ files and count matrices using Parse Batch Analysis on the DNAnexus platform.
-
The authors used Scanpy for single-cell processing and analysis. Initial filtering removed cells with fewer than 200 detected genes and genes detected in fewer than 2 cells, followed by sample concatenation. They then removed cells with more than 7,000 detected genes or more than 12% mitochondrial gene expression. Counts were normalized, log transformed, and scaled with a factor of 10,000.
-
For differential expression analysis, each condition was compared against all other conditions. The authors retained genes with a log fold change of at least 2 and a minimum p-value of at most 0.05, then used the top 122 genes per condition for consistency. Cell type annotations were assessed using EnrichR with Descartes or Cell Marker Augmented databases, using adjusted p-values of at most 0.05.
-
They also performed marker-based cell subsetting for CX3CR1 and P2RY12. Cells were retained if expression of the selected marker exceeded a threshold of 0.5. For these subsetted cells, the top 200 genes were analyzed with Gseapy to assess GO term pathways and cell type annotation using the Descartes cell atlas database.
-
The generated bulk RNA-seq and scRNA-seq data are publicly deposited in Gene Expression Omnibus under accession codes GSE287847, GSE287850, GSE287851, GSE287852, and GSE287853. Raw and source data are also provided in the Supplementary Information and Source Data files.
Method
The authors build a causal TF-gene regulatory inference framework that couples multiplexed TF perturbation, single-cell transcriptomic profiling, and stepwise regression. The central idea is to label each TF transgene with a DNA barcode, deliver barcoded TF cassettes into human iPSCs, and then recover both downstream gene expression and TF identity at single-cell resolution. This design transforms a pooled perturbation screen into a paired data structure in which each cell carries a transcriptomic profile and a quantitative TF perturbation signature.
The method begins with barcoded TF expression vector construction. TFs from the TFome collection are moved into a PiggyBac-compatible, doxycycline-inducible pBAN backbone. The original pBAN vector is digested and ligated with a synthetic double-stranded oligonucleotide that preserves the original structure while adding a 20-bp random barcode. Gateway cloning then transfers each TF into this barcoded vector, and Sanger sequencing confirms the TF-barcode assignment. The barcode therefore serves as a molecular identifier for the perturbation cassette, allowing TF expression to be quantified independently of endogenous transcript signals.
For perturbation, the authors deliver the barcoded TF vectors together with a Super PiggyBac transposase expression vector into hiPSCs by nucleofection, using a mass ratio of 4:1. After integration, cells are selected using drug-resistance markers and then induced with doxycycline to activate TF expression. Because multiple TF cassettes can be introduced into the same culture, the workflow supports pooled TF perturbation rather than one-gene-at-a-time manipulation. This is the key scaling component that allows many TF perturbations to be profiled within a common differentiation and sequencing process.
The readout architecture is based on single-cell RNA sequencing combined with targeted TF barcode amplification. Cells are processed using standard droplet-based 3′ scRNA-seq chemistry to generate transcriptome-wide expression data. A critical modification is that the cDNA produced during the scRNA-seq workflow is also used as template for TF barcode library preparation. Two sequential PCR reactions amplify molecules that contain cell barcodes, UMIs, and TF barcodes. In paired-end sequencing data, one read contains the 20-bp TF barcode, while the other contains the 16-bp cell barcode and the 12-bp UMI.
This paired sequencing design creates a molecular reconciliation step. Reads are grouped by matching read pairs, producing records of TF barcode, cell barcode, and UMI. Duplicate molecules are removed by discarding repeated combinations of TF barcode, cell barcode, and UMI. The remaining records are aggregated into a cell-by-TF count matrix. Because TF barcodes are derived from cDNA, the raw TF barcode counts are normalized by the total number of RNA UMIs detected in each cell. This normalization accounts for variation in sequencing depth and cDNA abundance across cells.
The pipeline then applies a reliability filter before regression. Each barcoded TF is observed through two measurements: barcode amplicon counts and TF RNA counts from scRNA-seq. TFs with a correlation coefficient greater than 0.3 between these two measurements are retained for network inference. This filtering criterion selects TFs whose barcode-based perturbation and RNA-based expression estimates are mutually consistent, reducing noise from low-expression or poorly recovered TF measurements.
The regression component constructs TF-gene regulatory networks using a stepwise selection procedure. For a target gene g, the model treats the normalized TF perturbation level as the independent variable and the gene expression level as the dependent variable. The basic linear relationship is represented as
Yg=β0+βtXt+ϵ,where Yg is the expression of target gene g, Xt is the perturbation level of TF t, βt is the regression coefficient, and ϵ is the residual error. During stepwise construction, candidate TFs are added to the model based on F-test statistics. At each iteration, the procedure fits models containing currently selected TF predictors and evaluates all possible single-variable additions. If the maximum F statistic for a candidate TF exceeds the critical value associated with the chosen significance level, that TF is added to the model. The variable selection process continues until no additional predictor satisfies the statistical threshold.
The resulting coefficients are interpreted as directional regulatory evidence. A positive coefficient indicates that the TF is associated with increased expression of the target gene, while a negative coefficient indicates association with decreased expression. The authors retain network edges only when both magnitude and significance pass stringent thresholds: ∣β∣>0.1 and −log10(p)>20. Edge sign is visualized by color, with red representing positive regulation and blue representing negative regulation, while edge width reflects coefficient magnitude.
As shown in the figure below:
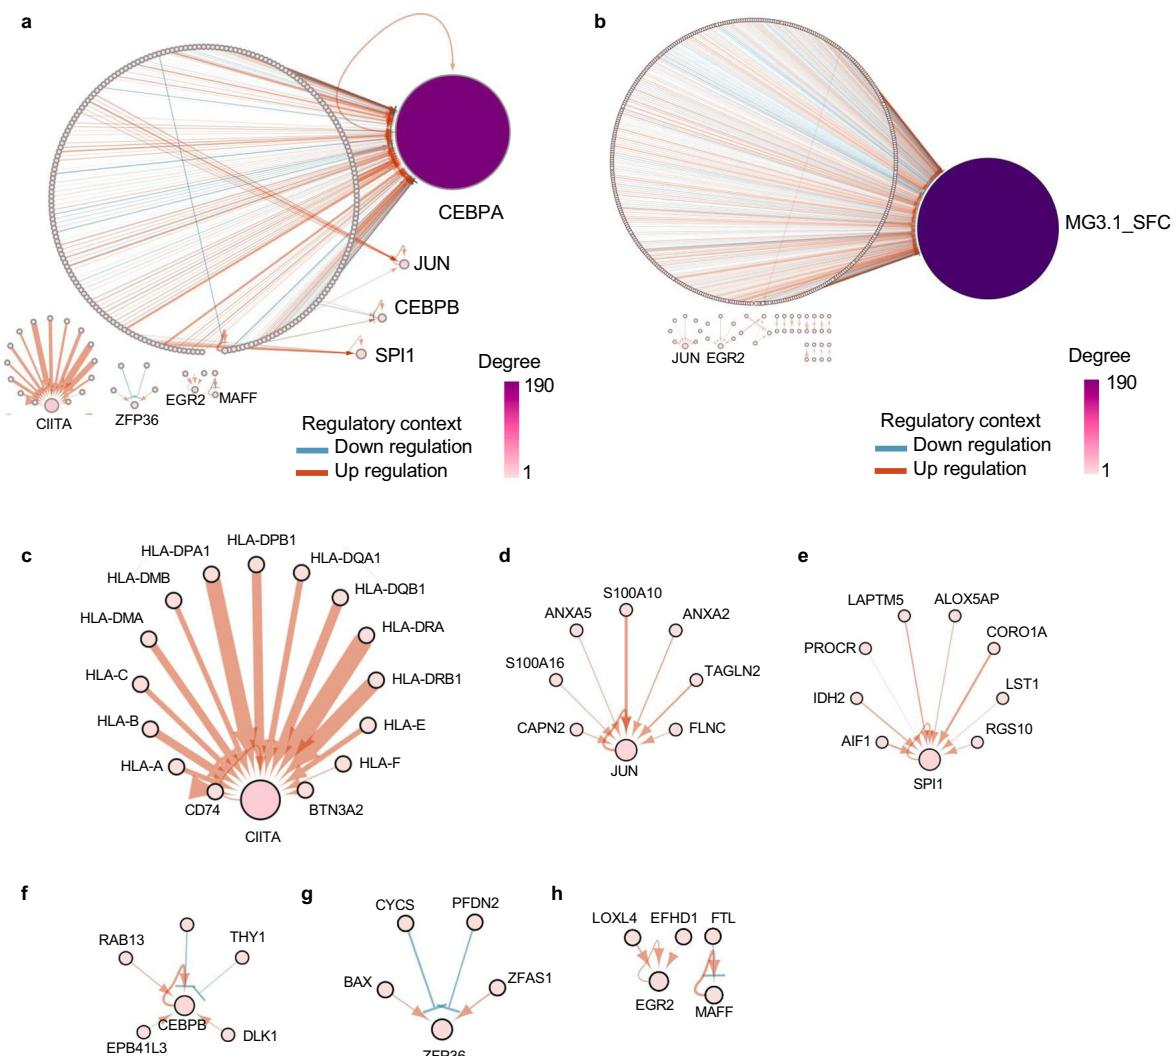
The framework diagram presents global networks for the first and second pooled TF perturbation screens, along with subnetworks for individual TFs such as CIITA, JUN, SPI1, CEBPB, ZFP36, and EGR2. These subnetworks illustrate how selected TF regulators connect to downstream genes with reproducible directionality and effect size. The visualization module therefore converts the fitted regression coefficients into interpretable regulatory maps, linking TF perturbation intensity to downstream transcriptional responses at the single-cell scale.
Experiment
Pooled barcoded transcription factor screens in human induced pluripotent stem cells were used to discover factors that activate microglial fate, and single cell transcriptomic coupling validated combinations capable of inducing core microglial genes. A six factor formulation most effectively generated microglia-like cells whose identity was supported by transcriptomic similarity to primary microglia, enrichment of microglial signatures, and stability of cell identity during early maturation. These cells also displayed functional microglial behaviors, including phagocytosis, ADP triggered calcium responses, and transcriptional activation by disease relevant stimuli, while regression of perturbation data revealed causal transcription factor gene regulatory relationships. Overall, the experiments validate an iterative, barcoded screening strategy for rational cell fate engineering and produce functionally relevant microglia-like cells.